Rocks & Soil: From Bedrock to Living Earth
Follow rock from solid bedrock to the grains in a soil sample. Explore what lives in each layer and test how soil texture changes the way water moves.
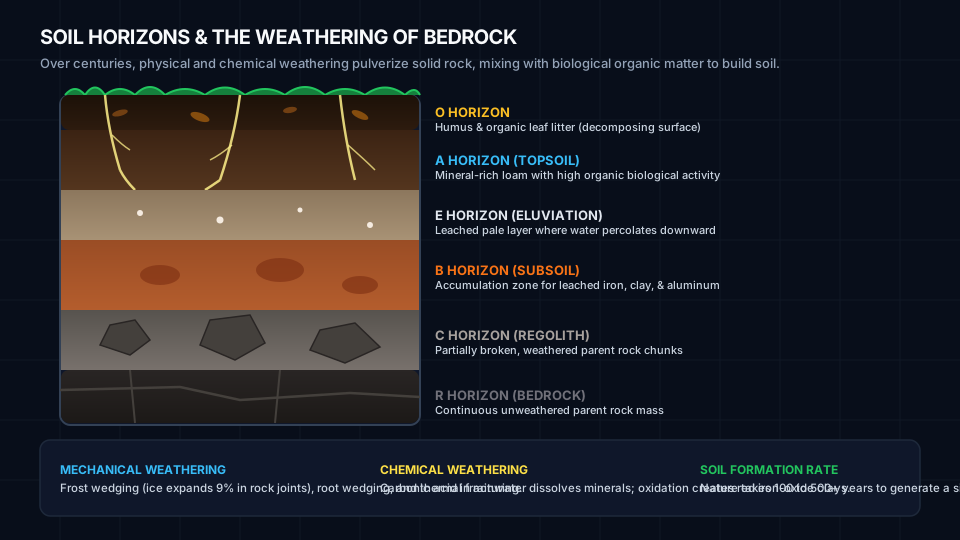
1 · The Living Soil Profile (Horizons O to R)
Start at the surface and work down to bedrock. Select a layer to see what collects there, which organisms live there, and how water moves through it.
Example depths. Real profiles vary, and some have no O or E layer.
O Horizon: Organic Humus Layer
The uppermost skin of the forest or meadow. Consists of decomposing plant debris, decomposing leaf litter, mycelial networks, insects, and dark decomposed organic matter (humus). Humus acts like a sponge, holding up to 90% of its weight in water.
2 · Bedrock Weathering Engine
Bedrock is torn down by two fundamental forces: Physical/Mechanical weathering (which fractures rock into smaller pieces without altering minerals) and Chemical weathering (which dissolves or transforms minerals into clays and oxides).
Frost Wedging (Ice)
Liquid water enters microscopic fissures. When temperature drops below 0°C, ice crystals expand by 9%, exerting outward pressures exceeding 200 megapascals—enough to shatter granite boulders.
Carbonation & Acid Rain
Rainwater naturally absorbs atmospheric CO₂ to form weak carbonic acid (H₂CO₃). On limestone (calcite CaCO₃), it dissolves the rock into soluble calcium bicarbonate, creating sinkholes and caverns.
Hydrolysis into Clay
When feldspar in granite reacts with acidic water, potassium ions are leached away and the hard silicate mineral breaks down into microscopic sheets of soft, hydrated kaolinite clay.
3 · The USDA Soil Texture Triangle
Soil texture is defined solely by the relative proportion of mineral particles smaller than 2 millimeters: Sand (0.05–2.0 mm, gritty), Silt (0.002–0.05 mm, floury), and Clay (< 0.002 mm, sticky). Drag the sliders or click on the triangle diagram to discover the 12 USDA textural classes.
4 · Soil Texture Hydrometer Jar (Stokes' Law)
Shake a soil sample in water and watch the grains separate. In this model, larger grains settle faster. Compare the bottom, middle, and top bands as the water clears.
Shake the jar or choose a time to inspect the sample.
The timeline is illustrative. Actual settling times depend on particle size, water temperature, and how well the grains disperse.
5 · Soil Percolation & Water Infiltration
Water movement through soil governs flood risk, groundwater aquifer recharge, and plant hydration. Test how identical 100 mL volumes of water drain through Sand, Loam, and Clay columns.
Predict which column will drain the most water.
Sand
Large pores
- Collected
- —
- In or above soil
- —
Loam
Mixed pore sizes
- Collected
- —
- In or above soil
- —
Clay
Small pores
- Collected
- —
- In or above soil
- —
Each collector uses the same 0–100 mL scale. The model uses fixed example values. Real drainage also depends on compaction, soil structure, and starting moisture.
6 · The Field Feel & Ribbon Test
Soil scientists in the field don't carry sieves or hydrometers. They use the tactile USDA Ribbon and Feel Method. Can you deduce the texture class of these four mystery biome field samples?
Sample #1: Georgia Piedmont Subsoil
You take a walnut-sized soil ball, moisten it, and squeeze it between your thumb and forefinger. It rolls smoothly without cracking and pushes out into a cohesive, flexible ribbon over 6 cm long before snapping. When rubbed against your palm with excess water, it feels greasy, shiny, and sticky with almost no gritty feeling.
- Ball test: Holds tightly together
- Ribbon length: > 5 cm (High plastic cohesion)
- Wet palm feel: Extremely sticky, zero grit
Field Soil Scientist Flowchart
Step 1: Ball Squeeze
Moisten a handful of soil. Squeeze into a ball. If it crumbles and cannot hold a ball shape, it is Sand.
Step 2: Ribbon Squeeze
Roll into a cigar-shaped cylinder (1/2" diameter). Push it upward between thumb and forefinger to form a ribbon of uniform thickness (1/8"). Let it self-break under its own weight:
- < 2.5 cm (1 inch): Loam / Silt Loam / Sandy Loam
- 2.5 to 5 cm (1–2 inches): Clay Loam / Silty Clay Loam
- > 5 cm (> 2 inches): Heavy Clay
Step 3: Wet Palm Grit Check
Pinch a small pea-sized pinch into your palm, add water, and rub with index finger. If gritty = Sand dominant; if silky/floury like talcum powder = Silt dominant; if sticky and stain-inducing = Clay dominant.