Space Science · Lesson 05 · SETI

Searching for Extraterrestrial Intelligence

Five connected stories about listening for technology beyond Earth, sending messages outward, and asking what the silence can — and cannot — tell us.

SETI listens and looks

Searches test radio, optical, and other data for technosignatures. The Wow! Signal is an unconfirmed historical candidate.

Messaging sends or carries information

Arecibo was a deliberate transmission, often called METI or active SETI. Voyager carries a passive artifact. Neither is a detection.

Message Decoder

Interactive
10×
Your browser cannot display the message canvas. The image encodes numbers, chemical elements, DNA, a human figure, the solar system, and the Arecibo telescope.

Click or hover any region to identify it

Hover over the message to explore
Each colored section encodes a different fact about life on Earth.

How the bits traveled

Frequency shift
Arecibo frequency-shift keying diagram A continuous radio carrier shifts between two frequencies ten hertz apart to encode zeros and ones at ten bits per second. continuous carrier near 2380 MHz 01 01 10 10 Hz apart10 bits/sec

Both binary states were transmitted. A 1 was not a pulse and a 0 was not silence; the transmitter shifted between two closely spaced frequencies.

A message still in transit

Arecibo Message travel timeline from Earth toward M13 Earth · 1974 M13 region · ~25,000 ly ~52 light-years traveled by 2026 the cluster moves while the signal travels

The transmission is only about 0.2% of the way to M13's present distance. Stars in the cluster will have moved before the beam reaches that region.

Binary Primer

How it works

The message contains 1679 bits. Each bit was encoded by shifting a continuous radio carrier between two frequencies about 10 Hz apart. Because 1679 factors into 23 × 73, a receiver could try those two rectangular orientations; one produces the intended pictorial arrangement, conventionally shown as 73 rows × 23 columns.

DecimalBinaryDecimalBinary
116110
2107111
31181000
410091001
5101101010

Legend

Key Facts

1679
Bits transmitted
73×23
Rows × columns
<3 min
Transmission time
M13
Target: 25,000 ly away
2.38 GHz
Radio frequency
~25,000 yr
Travel time (one way)

Why Prime Numbers?

1679 = 23 × 73. Both 23 and 73 are prime, which means there are only two non-trivial ways to arrange 1679 bits into a rectangle: 23 × 73 or 73 × 23 Drake and his collaborators hoped a receiver would recognize the factorization and try both orientations. One produces the intended pictorial layout, usually described as 73 rows × 23 columns. That is a decoding clue, not proof that an unfamiliar recipient would interpret every symbol as humans do.

The Story

  • 📡Sent on November 16, 1974 to celebrate the upgrade of the Arecibo Observatory in Puerto Rico — then the world's largest single-dish radio telescope (305 m diameter).
  • 👨‍🔬Written by Frank Drake, with input from Carl Sagan and other colleagues at Cornell.
  • 🌌Aimed at Messier 13, a globular cluster of ~300,000 stars in the constellation Hercules, about 25,000 light-years away.
  • 🔮The solar system part of the image includes Pluto because it was still classified as a planet in 1974.
  • 💬The beam was symbolic rather than a practical attempt at conversation. M13 will move substantially during the roughly 25,000-year trip, and a round-trip reply would take about 50,000 years.

Signal Viewer

Interactive
Your browser cannot display the signal chart. The six recorded intensity codes were 6, E, Q, U, J, and 5.

Hover over bars to see intensity values

The chart recreates the six measurements represented by 6EQUJ5. They rose to roughly 30.5 standard deviations above Big Ear's running baseline and fell over six 12-second reporting intervals. The narrowband signal was detected near the neutral-hydrogen line around 1420 MHz, but its origin was never established.

What the printout looked like

Reconstruction
  1  1  1  2  1  1  0  1  1  1
  1  1  1  2  1  6  1  1  1  1
  1  1  1  1  1  E  1  1  1  2
  2  1  1  1  1  Q  1  1  1  1
  1  1  2  1  1  U  1  1  1  1   ← Wow!
  1  1  1  1  1  J  1  2  1  1
  1  2  1  1  1  5  1  1  1  1

The famous characters were printed vertically in one 10 kHz-wide frequency channel. They are measurement codes, not a six-character alien message.

Why 72 seconds?

Big Ear beam-transit diagram Earth's rotation carries a fixed point in the sky through Big Ear's beam, creating a rise and fall over about 72 seconds. beam response expected from a fixed sky source 6 samples × 12 seconds ≈ 72-second transit window second horn later

The match to the telescope's beam shape made the event interesting, but 72 seconds is the observing window—not proof that the source itself transmitted for exactly 72 seconds. Big Ear's second horn did not detect it a few minutes later.

The “6EQUJ5” Explained

Notation

Big Ear compressed each measurement into one character. Digits and letters represent ranges of standard deviations above a running baseline; they are not exact raw power values:

CharacterIntensityCharacterIntensity
66 to <7 σU30 to <31 σ
E14 to <15 σJ19 to <20 σ
Q26 to <27 σ55 to <6 σ

Key Facts

72 sec
Beam-transit window
1420 MHz
Near hydrogen line
Big Ear
Telescope
Aug 15, 1977
Date
~30.5σ
Peak above baseline
Never
Repeated

The Story

  • 📡Detected by Ohio State University's Big Ear radio telescope during a SETI survey on August 15, 1977.
  • ✏️Astronomer Jerry Ehman circled the readout and wrote “Wow!” in the margin — giving the signal its famous name.
  • 🔭The signal came from one of two possible positions in Sagittarius; Big Ear's two feed horns created a location ambiguity.
  • ❓Follow-up observations have not recovered the signal. Natural and human-made explanations remain possible, so it is an unconfirmed candidate, not evidence of extraterrestrial intelligence.
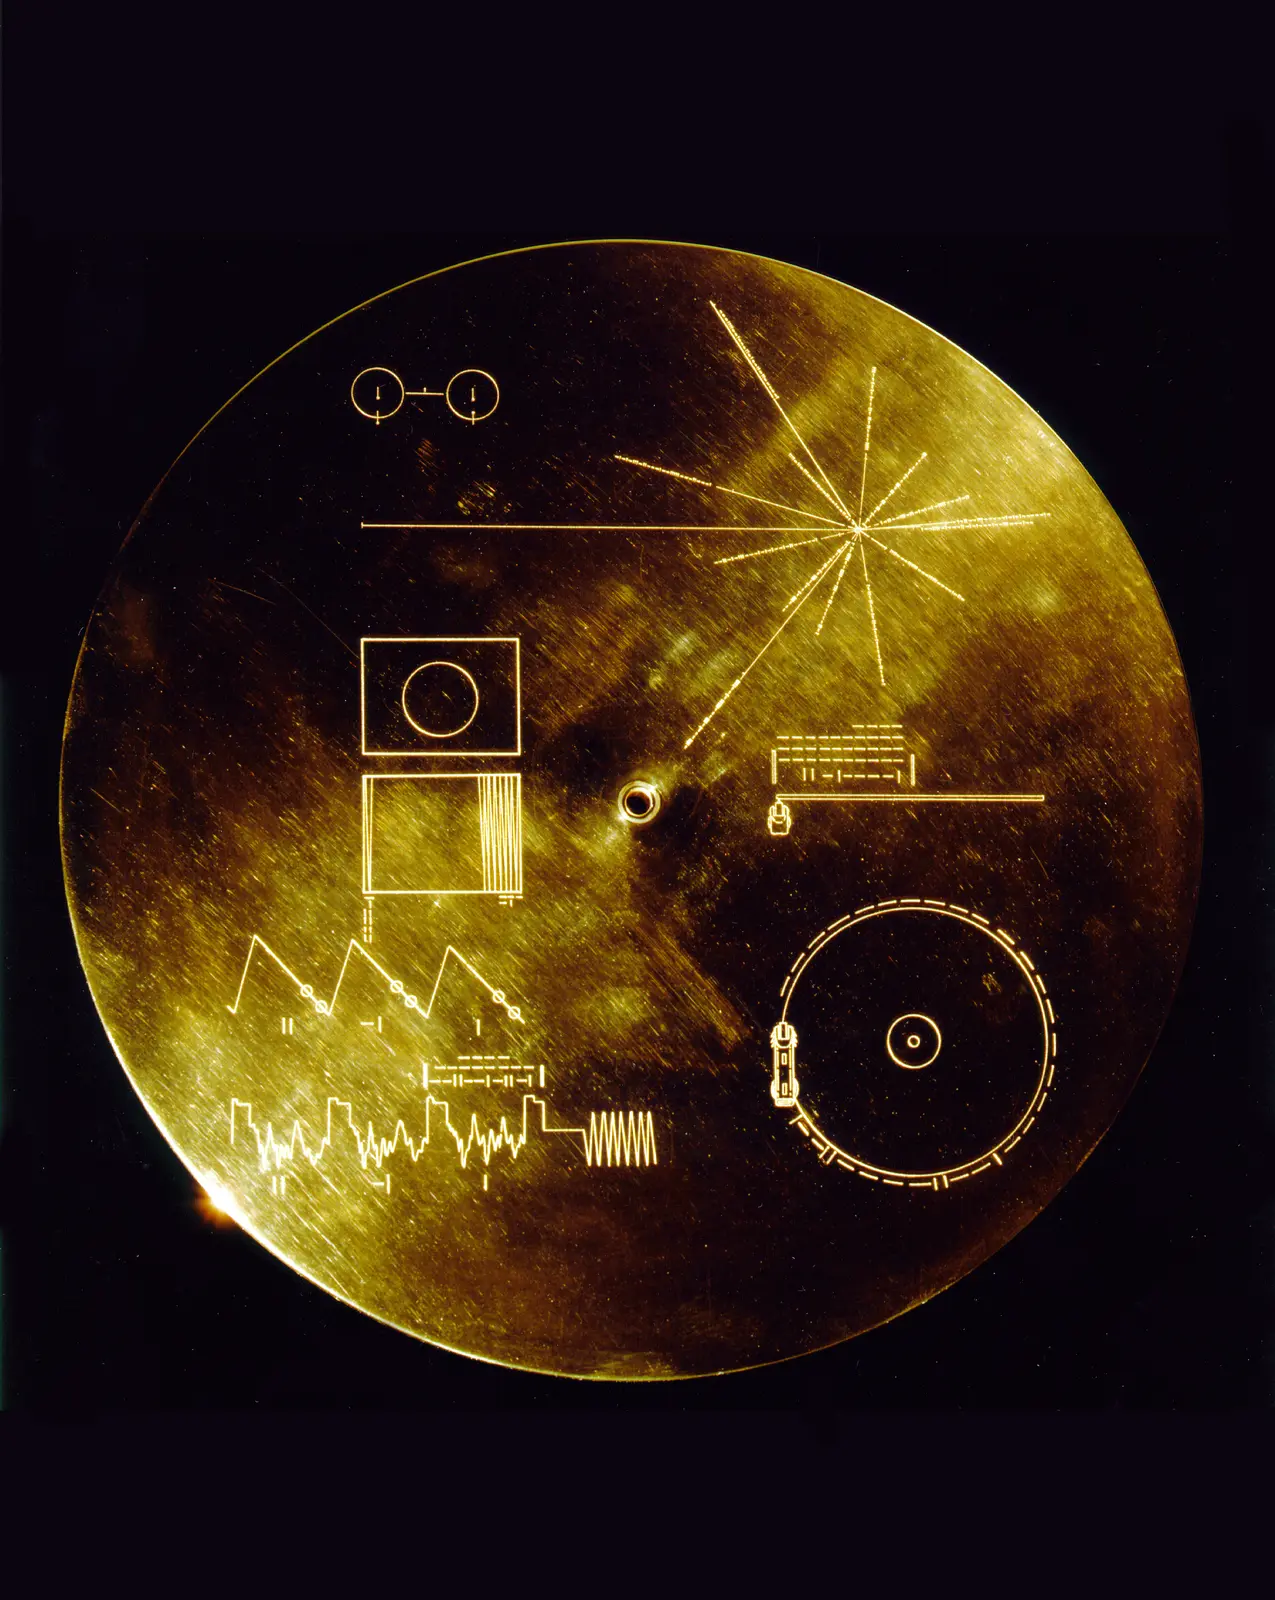
Photograph of the gold-colored Voyager record cover, engraved with scientific playback and location diagrams
The protective aluminum cover turns science into instructions: play the disc, rebuild its pictures, find our Sun, and estimate when it launched. Photo: NASA/JPL-Caltech.
Earth, 1977

A portrait of a planet

Each Voyager carries a 12-inch gold-plated copper record selected to portray life and culture on Earth. It combines analog pictures, greetings, natural and human-made sounds, and music from many places and eras.

The record is both a message for a possible finder and a mirror for us: a small team had to decide what one planet should say about itself.

As you explore, ask: What feels universal? What depends on culture? What voices or experiences would you add today?

Open the Earth archive

Interactive exhibit

Earth in 115 pictures

The sequence moves from mathematical and physical definitions to the Solar System, DNA and life, people, landscapes, food, work, buildings, transportation, and music. Copyright prevents reproducing most original frames here, so this classroom exhibit shows NASA mission photographs and age-appropriate summaries of the image themes.
Close photograph of the engraved Voyager Golden Record cover
Instructions without words. Binary numbers, hydrogen physics, a pulsar map, and playback diagrams give a finder the keys to the archive. Photo: NASA/JPL-Caltech.
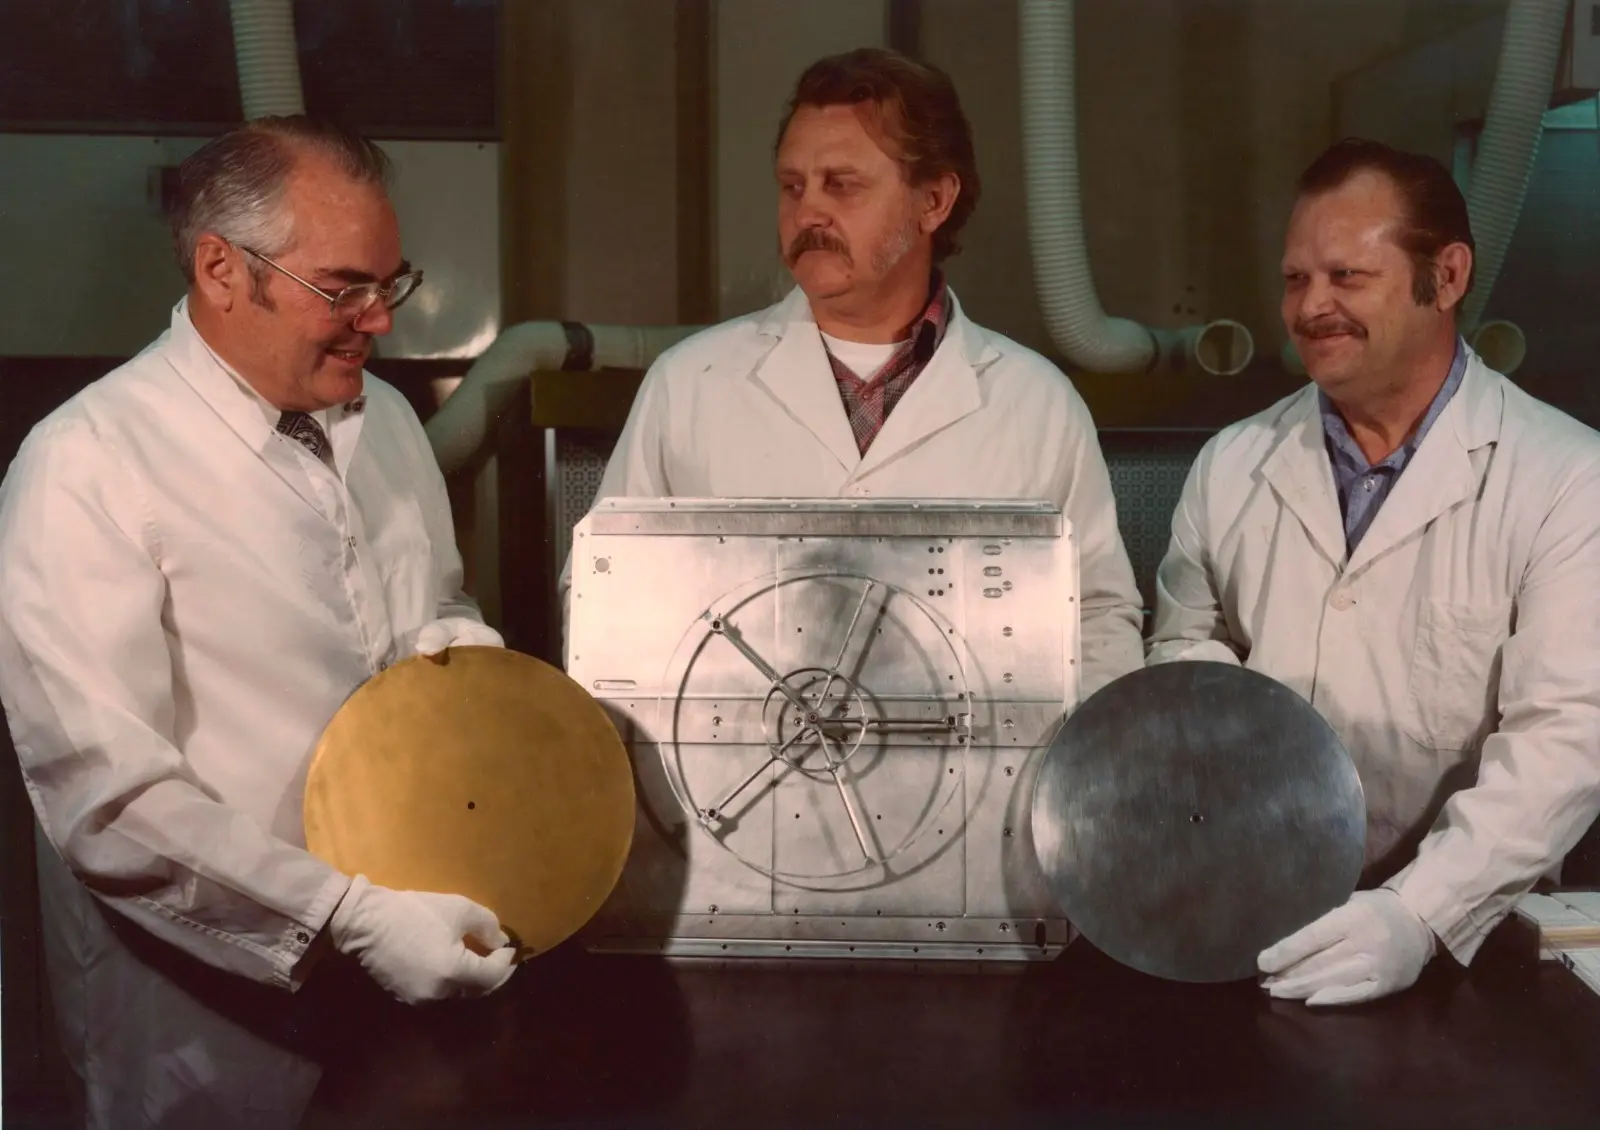
Three technicians displaying the gold record, protective cover, and carrying assembly
A physical time capsule. Technicians display the record, its protective cover, and the reel-like assembly in May 1977. Photo: NASA/JPL-Caltech.
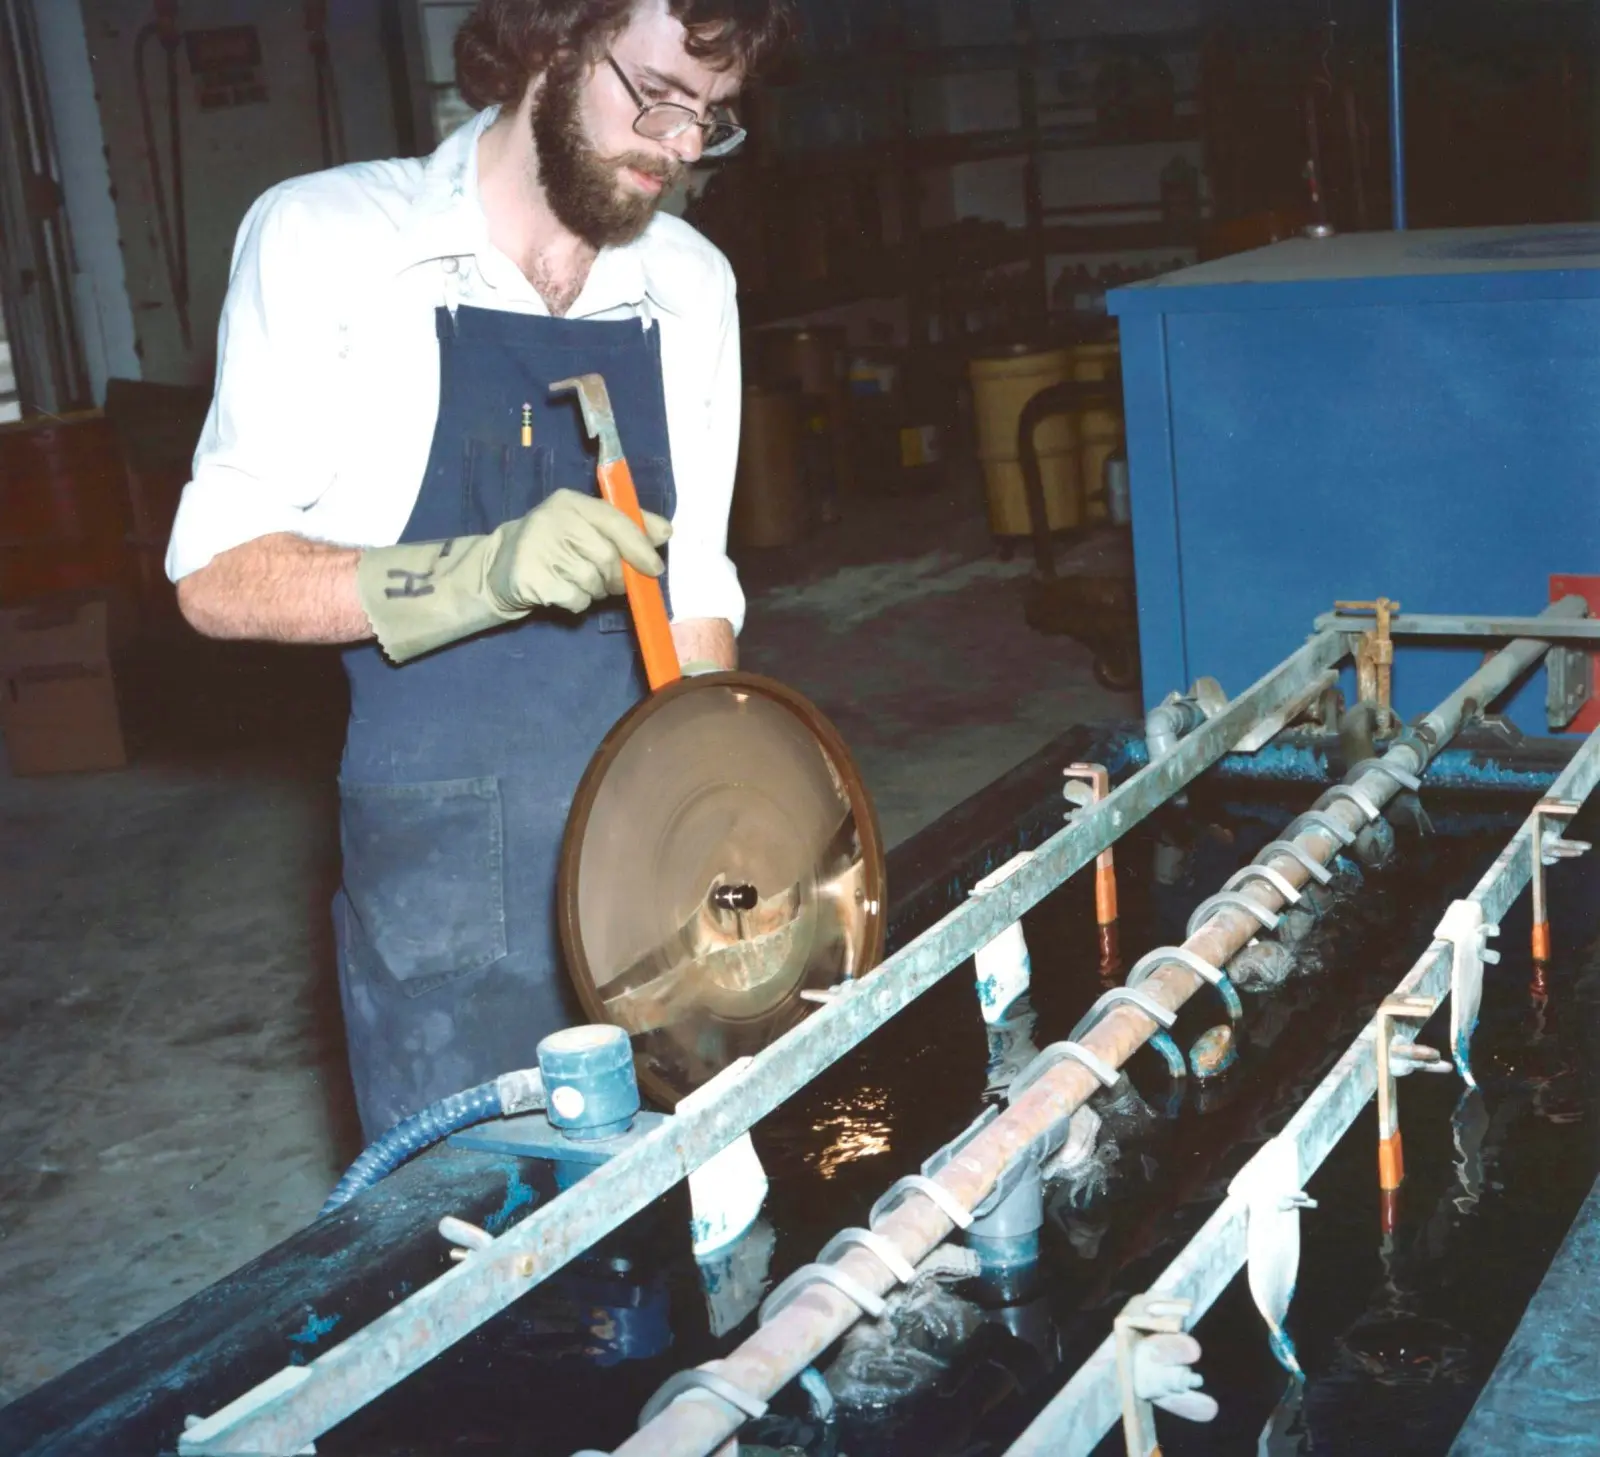
Technician working with a circular Golden Record part in a 1977 production facility
Made by human hands. A technician works on Golden Record production in 1977. Photo: NASA/JPL-Caltech.
How to measure

Numbers, units, chemistry, and a calibration circle try to build a shared scientific vocabulary.

Our cosmic address

The Sun, planets, Earth, and a pulsar map place our home in a much larger universe.

Life and change

DNA, cells, anatomy, growth, families, animals, and plants present living systems.

People together

Children, families, meals, learning, art, and communities show cooperation and relationship.

Work and invention

Farming, craft, construction, factories, travel, and telescopes show people changing their world.

Land and water

Mountains, forests, shores, deserts, weather, and wildlife show Earth's variety.

1. Sound becomes brightness

The record stores picture information as a changing analog signal, not as a JPEG or pixel file.

Teacher note: The original archive includes clinical anatomy and reproduction imagery. This K–12 view summarizes those frames without displaying them. NASA's complete index can support teacher-led extension work.

Decode the cover

Diagram
Schematic of the Voyager Golden Record cover The circular cover contains playback instructions, picture decoding instructions, a pulsar map, a hydrogen reference, and a uranium clock. PLAYBACKPICTURE RASTERPULSAR MAPHYDROGENU-238 CLOCK
Playback: stylus position, play direction, and a 3.6-second rotation.
Pictures: reconstruct 512 scan lines; the first circle checks the shape.
Location: 14 pulsars point back to the Sun with distinctive timing signatures.
Units: hydrogen supplies a reference time shared by physics everywhere.
Age: uranium-238 plating on the cover acts as a long-lived clock.

A time capsule with a point of view

  • 📅The record captures choices made in 1977, not a complete or neutral portrait of humanity.
  • 🌎The team sought global range, but time, access, copyright, and the curators' own knowledge shaped what was included.
  • 🎵European concert music receives several slots, while enormous regions and many living traditions are represented by one selection or none.
  • 🗣️Some catalog labels use terms common in 1977 that communities may describe differently today. This exhibit uses current place and people names where possible.
  • 🤔Media literacy: every archive tells two stories—the story in its contents and the story of who chose them.

Design a 2026 Golden Record

Create
Choose one image, one sound, one greeting, and one piece of music. For each choice, explain what it teaches about Earth without assuming the finder shares our language or culture. Then answer: Whose point of view is represented, and what is still missing?

Sources and image credits

Drake Equation Calculator

Interactive
N = R★ × fp × ne × fl × fi × fc × L
175
Estimated number of communicating civilizations in our galaxy (N)
<1110010K1M+
R★
Stars formed/year
7
fp
Fraction with planets
0.5
ne
Suitable worlds/system
1
fl
Fraction with life
0.5
fi
Fraction with intelligence
0.1
fc
Detectable technology
0.1
L
Detectable years (log)
10,000
Transparent classroom scenarios

These are labeled examples, not consensus forecasts. Select one to reveal all seven assumptions, then change any slider.

Key Facts

1961
Year proposed
F. Drake
Creator
Green Bank
WV conference
7
Variables
Ozma
First SETI search, 1960
N = ?
Still debated

Most Uncertain Variable?

L is highly influential because it directly measures how long a civilization remains detectable, but it is not the only deep uncertainty. We have no extraterrestrial examples with which to measure how often life, intelligence, or detectable technology arise. The equation organizes assumptions; it does not produce a measured census.

How well do we know each term?

R★
observed
fp
well sampled
ne
model-based
fl
one example
fi
unknown
fc
unknown
L
unknown

Qualitative evidence guide, not error bars. Exoplanet surveys constrain the astronomical terms far better than the biological and technological terms.

How a modern SETI search works

Evidence pipeline
Illustrative SETI waterfall plot A narrow slanted line across a time-frequency plot represents a candidate signal with Doppler drift. candidate with Doppler drift frequency → time →
1 · ObserveScan chosen stars, sky regions, wavelengths, and times.
2 · FlagSoftware finds narrowband, pulsed, or otherwise unusual candidates.
3 · Reject interferenceCompare other sky positions, telescopes, satellites, and local transmitters.
4 · ReobserveA credible candidate must repeat independently before confirmation.

Illustrative radio waterfall plot. SETI also searches for optical pulses, unusual atmospheric chemistry, waste heat, and other possible technosignatures.

The Fermi Paradox

The Great Silence

In the summer of 1950, physicist Enrico Fermi was having lunch with colleagues at Los Alamos National Laboratory. The conversation turned to flying saucers and the probability of extraterrestrial life. After some discussion, Fermi suddenly asked: “Where is everybody?”

The Milky Way is roughly 13.6 billion years old and contains an estimated 100–400 billion stars. Planets are common, so even slow interstellar expansion could, under some assumptions, spread through the galaxy on a timescale much shorter than its age.

Yet no extraterrestrial technosignature has been confirmed. That is not the same as searching everywhere and finding nothing: observations have sampled only a tiny fraction of possible locations, frequencies, signal types, sensitivities, and times.

The Fermi Paradox is the tension between arguments that technological life or its traces could be widespread and the absence of confirmed evidence so far. The probability of other civilizations is not yet known.

Proposed Solutions

Speculative hypotheses
This hypothesis proposes that complex life may require an uncommon combination of planetary and stellar conditions. Several proposed requirements remain debated, and we currently have only one inhabited planet to compare.
One or more transitions between lifeless worlds and long-lived technological societies may be extremely improbable. The idea does not identify which transition is difficult, or show whether it lies in humanity's past or future.
This hypothesis imagines that advanced civilizations could observe Earth while avoiding obvious contact. It is difficult to test and has no supporting observational evidence.
This fiction-inspired hypothesis proposes that civilizations might hide because the intentions of others are unknowable. It is a strategic thought experiment, not an evidence-backed conclusion that broadcasting is dangerous.
A simulation could be defined to contain no visible extraterrestrial life, but this proposal does not currently provide a testable astronomical explanation.
Some technological civilizations might have short detectable lifetimes because of collapse, deliberate silence, or changing technology. There is no evidence that self-destruction is inevitable.
Complex life and technology may require unusually long chains of events. Humanity could be early relative to the era in which habitable environments remain available, though this is not yet testable with a single known biosphere.
Space is unfathomably vast. Even advanced civilizations may never cross interstellar distances. The nearest star is over 4 light-years away. At current rocket speeds, it would take tens of thousands of years to reach it.

Key Facts

1950
Fermi's question
13.8B yr
Age of universe
Tiny slice
Search space sampled
100–400B
Stars in the Milky Way
Planets common
Life frequency unknown
0
Confirmed technosignatures

The search-space problem

Important: an empty search result constrains only the place, time, frequency, sensitivity, and signal type actually observed. The grid is illustrative, not a measured fraction.

What Do You Think?

Given everything you've learned in this lesson — the Arecibo Message, the Wow! Signal, the Golden Record, and the Drake Equation — where do you stand? Write a paragraph explaining your answer to Fermi's question: Where is everybody?